How Many People Voted Early in 2026? 59 Million Ballots Before Election Day, by State
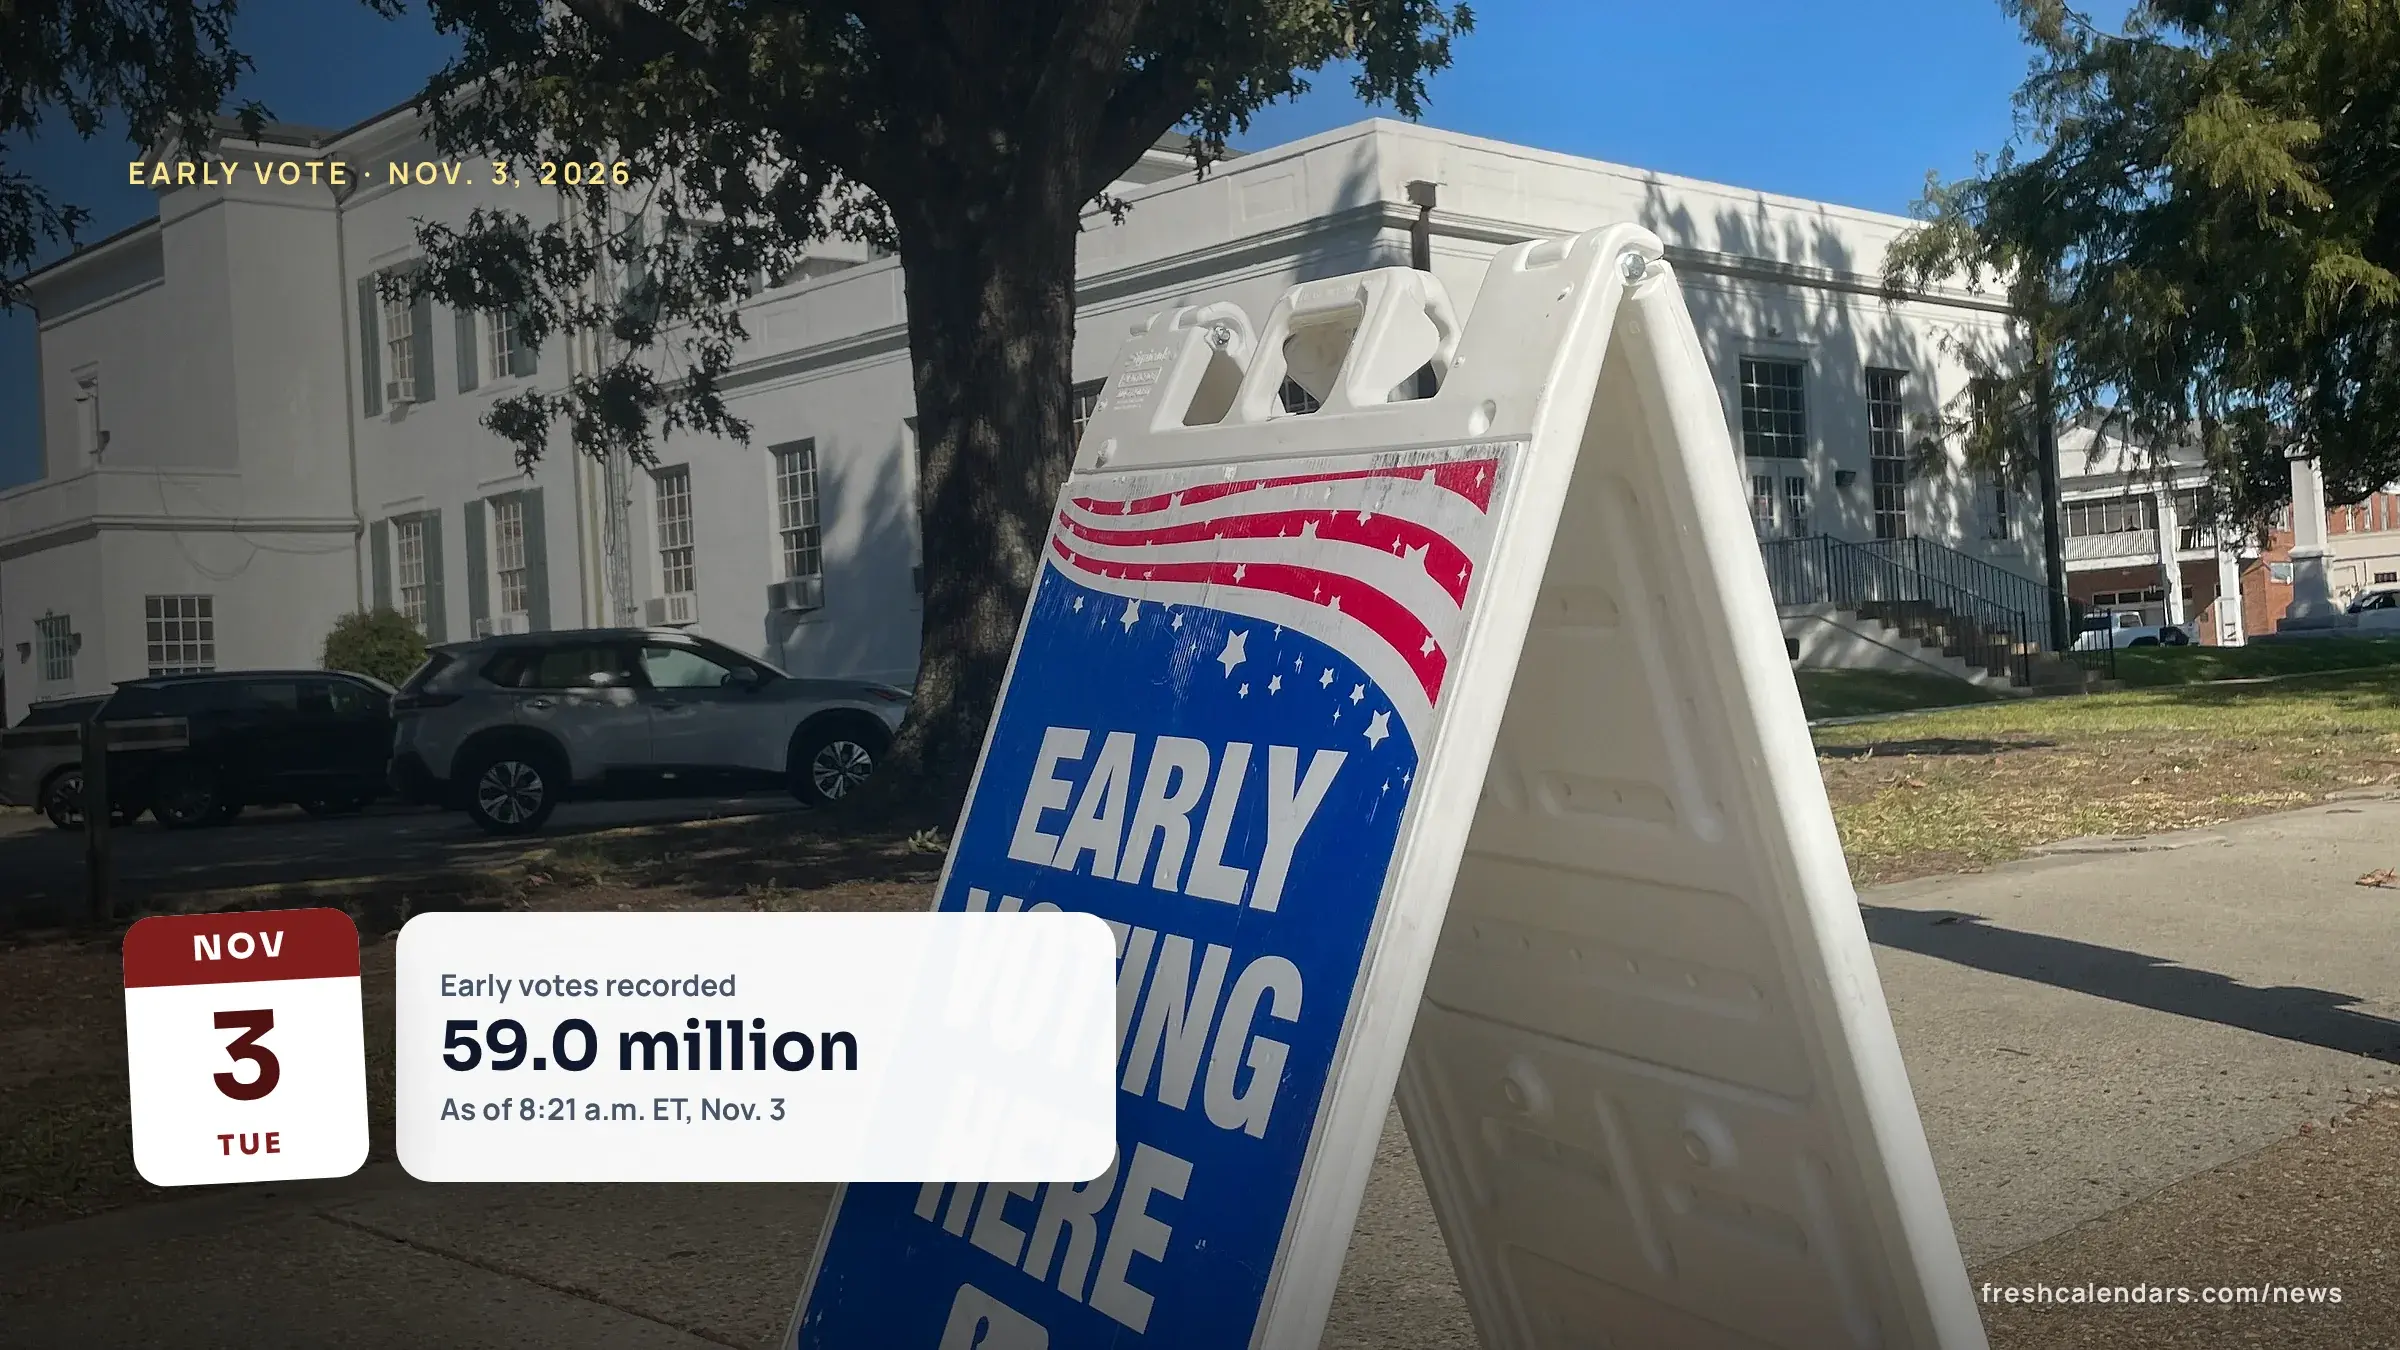
The University of Florida (UF) Election Lab counted 59,014,258 early votes as of 8:21 a.m. Eastern Time (ET) on Nov. 3, 2026. Totals for every state and D.C.

Published 6 min read

In this article
- How many people have voted early in 2026?
- How fast did the early vote count grow?
- Early votes by state, 2026
- Which states have the highest early vote compared with 2022?
- What do 34.2 million mail ballots not yet returned mean?
- What does an official state count look like?
- What the early vote count does not show
- Print the early vote by state list
The University of Florida (UF) Election Lab tracker counted 59,014,258 early votes as of 8:21 a.m. Eastern Time (ET) on Tuesday, Nov. 3, 2026, split between 31,900,671 cast in person and 27,113,587 mail ballots returned. The tracker covers 48 states and the District of Columbia (D.C.); Alabama and New Hampshire have no early vote data in its file. The figures below are a preliminary snapshot, not final turnout, and they do not show how anyone voted.
Election Day is today. For early voting end dates in the states we covered, see our story on which states had early voting.
How many people have voted early in 2026?
The UF Election Lab, run by Dr. Michael McDonald, a professor at the University of Florida, gathers early vote counts from state and local election offices. Its page notes that some states do not provide daily updates and links to the original data where possible.
| Measure | Count | Share of early votes |
|---|---|---|
| Total early votes | 59,014,258 | 100% |
| In person | 31,900,671 | 54.1% |
| Mail ballots returned | 27,113,587 | 45.9% |
| Mail ballots requested | 61,343,169 | not applicable |
Source: University of Florida Election Lab, 2026 Early Voting tracker, last updated 8:21 a.m. ET, Nov. 3, 2026. Shares are our calculation.
The tracker’s 49 jurisdictions cast 109,979,856 total ballots in the 2022 general election, by the tracker’s 2022 turnout column. The 59,014,258 early votes so far equal 53.7% of that figure, our calculation. That is a comparison with all 2022 ballots, not with 2022 early votes: we do not give a national 2022 early vote total because published figures for it differ.
How fast did the early vote count grow?
News reports of the same tracker show the climb over the final days.
| Date and time | Early votes | Reported by |
|---|---|---|
| Sunday, Nov. 1, 6:56 a.m. ET | 53.14 million | Al Jazeera, citing the UF analysis |
| Monday, Nov. 2, afternoon | More than 57 million | ABC7 New York, citing the UF Election Lab |
| Tuesday, Nov. 3, 8:21 a.m. ET | 59,014,258 | UF Election Lab tracker |
Between Sunday morning and Tuesday morning the count rose by about 5.9 million, our calculation from the two reported figures. Each figure comes from a different update of the tracker, so treat the intervals as rough.
Early votes by state, 2026
The table lists all 48 states and D.C. in the tracker, ranked by total early votes. The last column is our calculation: early votes so far as a share of all ballots cast in that state in the 2022 general election, from the tracker’s 2022 turnout column. It is not a turnout rate for 2026.
| State | Early votes | In person | Mail returned | Share of 2022 total ballots | Data date |
|---|---|---|---|---|---|
| Texas | 7,736,594 | 7,466,245 | 270,349 | 94.9% | 11/2 |
| California | 6,662,914 | 298,511 | 6,364,403 | 59.8% | 11/2 |
| Florida | 5,464,802 | 3,467,810 | 1,996,992 | 70.1% | 11/2 |
| Georgia | 2,834,893 | 2,705,120 | 129,773 | 71.5% | 11/3 |
| North Carolina | 2,828,288 | 2,728,268 | 100,020 | 74.6% | 11/3 |
| Michigan | 2,313,206 | 684,492 | 1,628,714 | 51.4% | 11/2 |
| New York | 2,110,908 | 1,965,043 | 145,865 | 35.4% | 11/2 |
| Washington | 1,992,533 | 0 | 1,992,533 | 65.0% | 11/2 |
| Colorado | 1,859,900 | 38,976 | 1,820,924 | 73.2% | 11/2 |
| Ohio | 1,728,899 | 1,103,252 | 625,647 | 41.2% | 11/2 |
| Arizona | 1,648,197 | 0 | 1,648,197 | 63.6% | 11/2 |
| Virginia | 1,644,509 | 1,313,198 | 331,311 | 54.4% | 11/3 |
| Illinois | 1,579,728 | 904,143 | 675,585 | 38.1% | 11/2 |
| Oregon | 1,481,943 | 0 | 1,481,943 | 74.2% | 11/2 |
| Tennessee | 1,280,642 | 1,280,642 | 0 | 72.9% | 10/30 |
| New Jersey | 1,240,049 | 642,644 | 597,405 | 46.9% | 11/3 |
| Massachusetts | 1,161,295 | 347,336 | 813,959 | 46.2% | 11/2 |
| South Carolina | 1,084,542 | 1,043,810 | 40,732 | 63.1% | 11/2 |
| Pennsylvania | 1,062,313 | 0 | 1,062,313 | 19.6% | 11/2 |
| Maryland | 993,206 | 604,396 | 388,810 | 48.9% | 11/2 |
| Minnesota | 886,427 | 619,847 | 266,580 | 35.1% | 11/2 |
| Indiana | 884,186 | 0 | 884,186 | 47.0% | 11/3 |
| Wisconsin | 777,739 | 463,491 | 314,248 | 29.1% | 11/2 |
| Nevada | 753,056 | 308,025 | 445,031 | 73.6% | 11/2 |
| Utah | 583,623 | 13,689 | 569,934 | 53.8% | 11/3 |
| Arkansas | 550,338 | 540,941 | 9,397 | 60.2% | 11/2 |
| Louisiana | 535,957 | 448,585 | 87,372 | 38.0% | 11/3 |
| Connecticut | 505,945 | 455,169 | 50,776 | 39.0% | 11/2 |
| Kansas | 470,170 | 392,184 | 77,986 | 46.6% | 11/2 |
| Iowa | 464,008 | 314,683 | 149,325 | 37.7% | 11/2 |
| New Mexico | 456,726 | 385,114 | 71,612 | 63.9% | 11/2 |
| Kentucky | 438,602 | 390,736 | 47,866 | 29.2% | 11/2 |
| Montana | 331,826 | 0 | 331,826 | 70.9% | 11/3 |
| Maine | 300,491 | 0 | 300,491 | 44.1% | 11/2 |
| Idaho | 263,250 | 144,149 | 119,101 | 44.2% | 11/2 |
| Missouri | 260,656 | 226,882 | 33,774 | 11.3% | 10/29 |
| Hawaii | 249,140 | 5,472 | 243,668 | 58.8% | 11/2 |
| Nebraska | 237,135 | 47,443 | 189,692 | 34.7% | 11/2 |
| Oklahoma | 229,159 | 186,488 | 42,671 | 19.9% | 11/2 |
| Vermont | 150,202 | 0 | 150,202 | 51.4% | 11/2 |
| Delaware | 148,738 | 0 | 148,738 | 45.7% | 11/2 |
| Rhode Island | 138,314 | 112,046 | 26,268 | 38.3% | 11/2 |
| Mississippi | 116,453 | 0 | 116,453 | 16.4% | 11/2 |
| West Virginia | 114,391 | 109,902 | 4,489 | 23.1% | 10/29 |
| District of Columbia | 111,150 | 27,118 | 84,032 | 54.0% | 11/2 |
| North Dakota | 101,160 | 50,489 | 50,671 | 41.7% | 11/2 |
| Alaska | 99,424 | 64,332 | 35,092 | 37.2% | 11/2 |
| South Dakota | 81,367 | 0 | 81,367 | 22.9% | 11/2 |
| Wyoming | 65,264 | 0 | 65,264 | 32.9% | 11/2 |
Source: University of Florida Election Lab, 2026 Early Voting tracker, read at 8:25 a.m. ET, Nov. 3, 2026; shares are our calculation. The data date is the day of the state’s latest report (month and day, 2026).
Notes on reading the table:
- Missouri and West Virginia data are dated Oct. 29, and Tennessee’s Oct. 30 (in person only), so those totals are behind the rest.
- Kentucky and Maryland reports are one day behind.
- Michigan’s in-person figure is estimated by the lab from application data.
- A zero in the in-person column means the state votes mainly by mail or reports a single combined figure. Washington, Oregon, Colorado, Utah, Hawaii and Vermont vote mostly by mail, and Arizona, Pennsylvania, Indiana and Montana report one figure.
- Alabama and New Hampshire are not in the tracker.
Which states have the highest early vote compared with 2022?
Ranked by the share of 2022 total ballots rather than by raw count, smaller states rise. Texas leads, followed by North Carolina and Oregon.
| Rank | State | Early votes, 2026 | Share of 2022 total ballots |
|---|---|---|---|
| 1 | Texas | 7,736,594 | 94.9% |
| 2 | North Carolina | 2,828,288 | 74.6% |
| 3 | Oregon | 1,481,943 | 74.2% |
| 4 | Nevada | 753,056 | 73.6% |
| 5 | Colorado | 1,859,900 | 73.2% |
| 6 | Tennessee | 1,280,642 | 72.9% |
| 7 | Georgia | 2,834,893 | 71.5% |
| 8 | Montana | 331,826 | 70.9% |
| 9 | Florida | 5,464,802 | 70.1% |
| 10 | Washington | 1,992,533 | 65.0% |
Source: University of Florida Election Lab, 2026 Early Voting tracker, Nov. 3, 2026; shares are our calculation. Tennessee’s data is dated Oct. 30.
A high share does not mean a state’s final turnout will beat 2022. Votes cast on Election Day come on top of the early vote.
What do 34.2 million mail ballots not yet returned mean?
The tracker lists 61,343,169 mail ballots requested and 27,113,587 returned. The difference, 34,229,582, is our calculation: ballots requested that were not yet recorded as returned at 8:21 a.m. ET.
That figure is not a count of ballots that will go uncounted. Many may still be returned or dropped off today. Deadlines differ by state; see our guide to mail ballot deadlines by state for where a ballot must arrive and where a Nov. 3 postmark counts.
What does an official state count look like?
State offices publish their own figures, and they can differ from the tracker because they are cut at a different time. The Colorado Secretary of State reported that as of 11:59 p.m. on Sunday, Nov. 1, 2026, 1,599,988 ballots had been returned statewide, against 1,339,399 at the same point in 2022. That is about 19.5% more, our calculation. The UF tracker’s Colorado line, 1,859,900 as of Nov. 2, is a later snapshot.
What the early vote count does not show
The numbers count ballots, not choices. They do not show who is ahead, and ballots are not counted until Election Day under state law, although the tracker notes that officials may prepare ballots in advance. The count is also not final turnout: in-person voting today and mail ballots still arriving add to it. For when results start to come in, see when we will know the 2026 election results. To plan the rest of the month, use the November 2026 printable calendar or the 2026 printable yearly calendar.
Print the early vote by state list
A one-page list of the 20 states with the most early votes, with each state’s share of its 2022 total ballots, is in the downloads below.
Free printable downloads
Every template is free, needs no sign-up and prints on US Letter paper. Choose PDF for printing or PNG for screens and documents.
2026 Early Vote by State printables
-
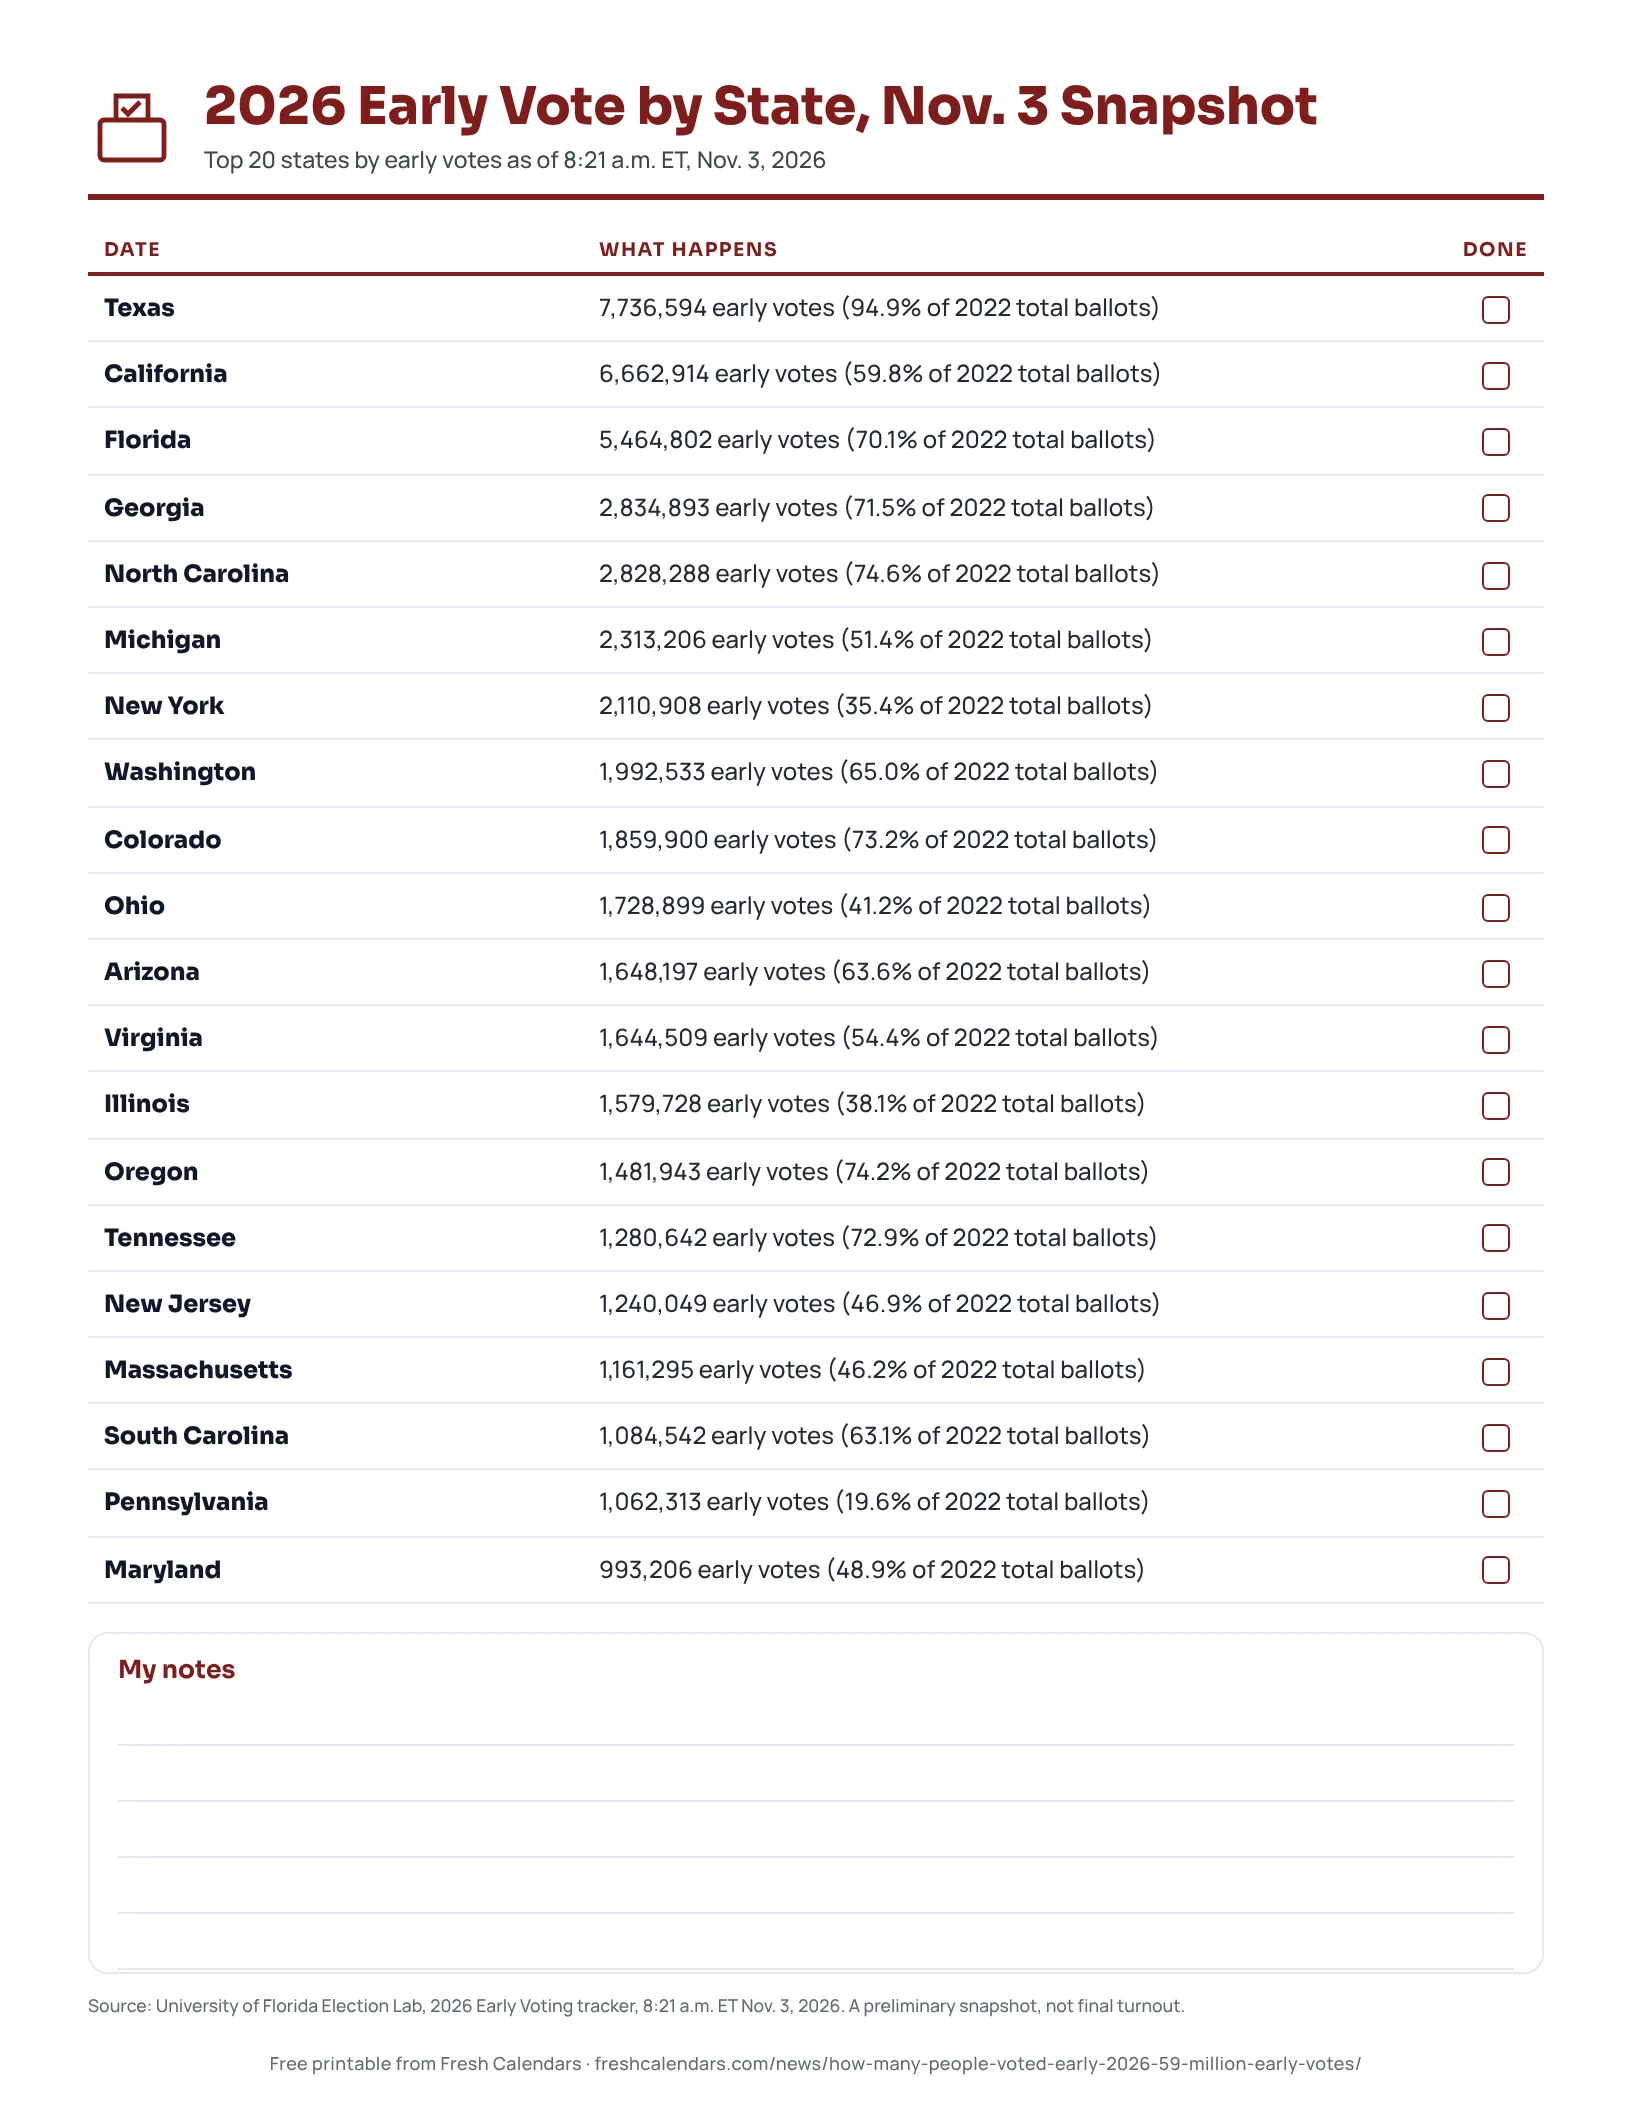
2026 Early Vote by State, Nov. 3 Snapshot
Early votes recorded in the 20 states with the most, with each total as a share of the state's 2022 total ballots.
Frequently asked questions
How many people voted early in 2026?
The University of Florida Election Lab tracker showed 59,014,258 early votes as of 8:21 a.m. ET on Nov. 3, 2026: 31,900,671 in person and 27,113,587 by mail. The tracker covers 48 states and D.C.
Does early voting show who is winning?
No. The numbers count ballots cast, not choices. Under state law ballots are not counted until Election Day, although the tracker notes that officials may prepare ballots in advance.
Is 59 million the final turnout?
No. It is a snapshot taken the morning of Election Day. Votes cast in person on Election Day come on top of it, and mail ballots are still arriving.
Where can I see my state's early vote numbers?
The University of Florida Election Lab 2026 Early Voting tracker lists each state and links to the original data where possible. Your state election office publishes its own official figures, for example the Colorado Secretary of State's ballot-return release.
Sources
- 2026 Early Voting (University of Florida Election Lab, 2026-11-03)
- General Election Ballots Returned and Turnout Comparison: November 2, 2026 (Colorado Secretary of State, 2026-11-02)
- More than 50 million votes cast in US midterm elections: What does it mean? (Al Jazeera, 2026-11-01)
- Midterm elections 2026 live updates (ABC7 New York, 2026-11-03)
Related news
-
 Early Voting 2026: End Dates by State Before Election Day on Nov. 3
-
 When Will We Know the 2026 Election Results? How Counting Works and the Timeline in 17 Key States
-
 Mail Ballot Deadlines 2026 by State: When Your Ballot Must Arrive, and Where a Nov. 3 Postmark Still Counts
-
 Free Rides to the Polls 2026: Lyft VOTE26, Lime HEADCOUNT and Free Transit on Nov. 3
More in Elections
All Elections stories →- Election Day 2026 Weather: Mississippi Valley Storms, Florida Flooding and Moved Polls
- Ballot Cure Deadlines 2026: How to Fix a Mail Ballot Signature, Nov. 5 to Nov. 24
- Can I Drop Off My Mail-In Ballot on Election Day 2026? Where and Until When, by State
- What Is a Midterm Election? What Voters Decide on Nov. 3, 2026
- California Election Results 2026: Polls Close at 8 p.m. PT, and Counting Can Run to Dec. 3
Trending now
- Black Friday Canada 2026: Nov. 27 Date, Canadian Tire Deals From Nov. 5, Who Hasn't Announced
- Black Friday 2026 Deals: Date Is Friday, Nov. 27, Live Countdown and Ad Tracker
- November 2026 Meteor Showers: Taurid Fireballs Under Dark Skies, Then the Leonids on Nov. 16-17
- New York Ballot 2026: Sample Ballot, the Governor's Race, NYC's 5 Charter Questions and Key Dates
- Advent Calendar 2026: When to Start, Key Dates, Which Brand Calendars Are Confirmed and 4 Free Printables